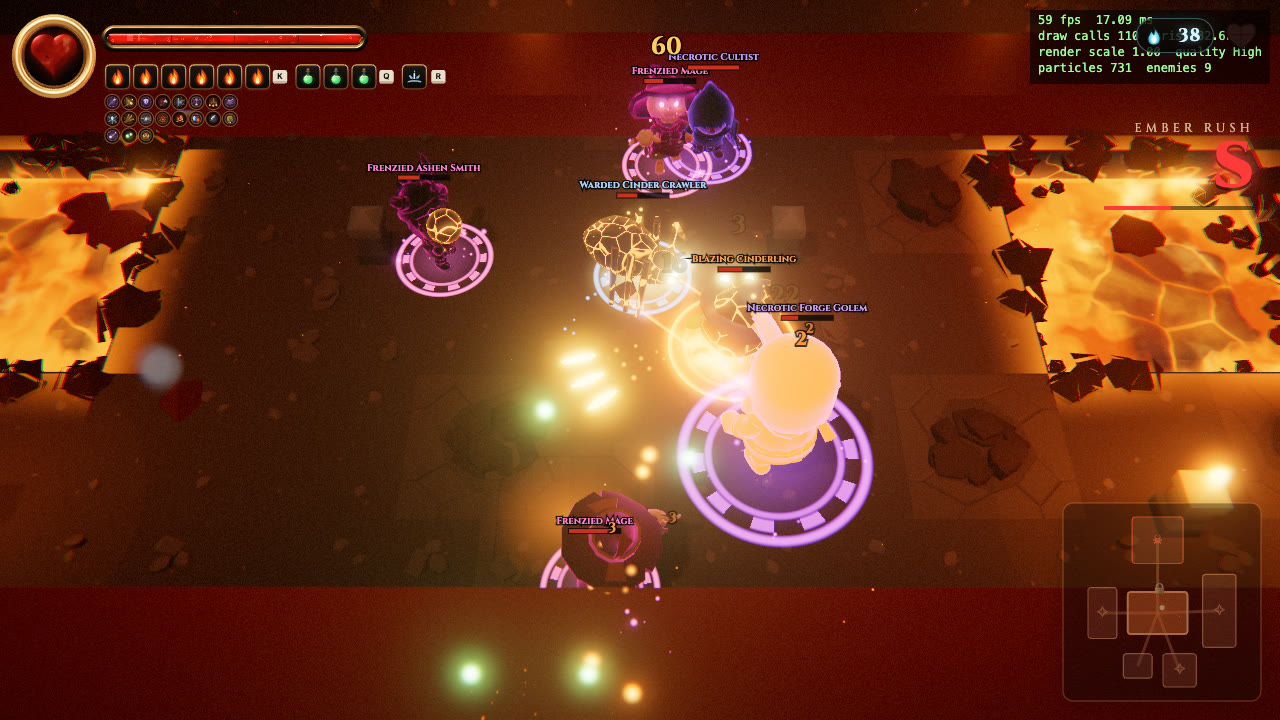
Kindlefall fights get busy. A dozen elites with auras and ward bubbles, a Pyromancer throwing arrows and fireballs, molten creatures spitting lobs, particles everywhere, lava moving under all of it. On our test machine it stays smooth through all of that. This post is how, with the measurements to back it up, including before-and-after profiles of old builds checked out from git.
The budget
The game caps itself at 60 frames a second by default, which gives every frame 16.7 ms. The cap exists because the development MacBook ran hot early on: its display runs at 120 Hz, and running uncapped meant doing twice the GPU work for no visible gain. Menus and the title run at 30 fps, and the High preset renders at 1.5 times the CSS resolution instead of full Retina 2x (Ultra is there if you want it).
The question is never just "is the average frame fast". It's "does any frame ever take longer than 16.7 ms", because one slow frame is a visible hitch. So every measurement here reports percentiles and the worst frame, not just averages.
What a frame actually costs
In Sprint #2 a dedicated Performance team profiled the game with real GPU rendering (Metal), forcing the GPU to finish every frame so its time was counted, with CPU and allocation profiles, and a tracker for shaders compiled late. Their scenarios: the busiest fight on every floor, every boss with its phases forced, a fight with four rounds of boons stacked, and a twelve-elite horde.
The finding: on Apple Silicon a frame costs about 1.7 ms of CPU and GPU, around a tenth of the budget. Fights on all seven floors measured a median of 1.6 to 1.8 ms and a 95th percentile of 2.0 to 2.4 ms after their work; the boon-stacked fight 2.1 ms median and the horde 2.3 ms. The game was never short of raw speed. What players feel are hitches: single long frames. The team found five causes and fixed all of them:
- Crumbling floors on Floor VI. Every tile that dropped rebuilt the enemies' navigation grid against every wall and pit on the whole floor: a 20 to 30 ms frame per tile, mid-fight. The rebuild now works in small tiles and only looks at obstacles nearby. A tile drop went from about 25 ms to under 1 ms, and building every floor's grid at load from 1.4 seconds to about 70 ms.
- Shaders compiled on first use. A handful of effects (Floor IV's trip-hammer beams, Floor V's surges and breakers, the Storm boons' bolts, the aim line and a few more) compiled their shader the first time they appeared, mid-fight: 13 to 450 ms once, and one 2-second outlier. They are now compiled during the warm-up behind the loading screen.
- Adaptive resolution churn. The game lowers its render resolution when frames get slow. Each change reallocates the render targets, 20 to 110 ms, and the old rule changed it too eagerly. Now it steps down only after 1.5 seconds of slow frames, steps up only after 6 seconds of headroom (and 20 seconds after a drop), and only in a calm room unless frames are badly slow. If frames stay slow even at reduced resolution, the game steps down one quality preset for the session, with a toast, and never saves it.
- Shadow-pass churn. One shared shadow material made three.js re-derive its shader program about 13 times a frame, creating garbage every frame. Skinned and instanced shadow casters now get their own material.
- Loading. Decoding the sound-effect sprite (1 to 2 seconds) ran one after the other with building the floors. Now they overlap, and the warm-up renders one floor per frame behind the loading screen instead of one long block. Load to title went from about 4 seconds to about 2.
Bosses on all seven floors went from worst frames of 4 to 24 ms (with shader-compile spikes of 13 ms to 2 seconds in some runs) to 3 to 9 ms, with no compiles mid-fight.
Before and after, profiled
To show the difference rather than just describe it, we checked three builds out of git into separate folders, served each on its own port, and ran the exact same scripted scenes on each in GPU Chrome, recording a real Chrome performance trace:
- Before Sprint #2 (commit b1ccb70), the build the Performance team started from;
- After perf round 1 (commit 2d02b95), with the five hitch fixes but before the memory-leak round;
- Today (commit 12eb2f9).
The scenes: the twelve-elite horde above, the Crumbling Gallery on Floor VI (where tiles drop), the Storm Seraph fight, and arriving on Floor V. Each ran twice per build, alternating builds. The test bot played; the hero was invincible so every run lasted the same time. "Frame cost" is the time from the start of a frame to the GPU finishing it.
| Scene | Build | p50 ms | p95 ms | p99 ms | worst ms | long tasks | draw calls |
|---|---|---|---|---|---|---|---|
| Horde: 12 elites, Floor IV | Before | 2.8 | 3.9 | 4.6 | 7.9 | 0 | 142 |
| Round 1 | 2.7 | 3.9 | 4.5 | 8.8 | 0 | 139 | |
| Today | 2.9 | 4.1 | 4.9 | 7.9 | 0 | 143 | |
| Crumbling Gallery, Floor VI | Before | 2.0 | 3.5 | 7.6 | 12.2 | 0 | 55 |
| Round 1 | 2.0 | 3.1 | 3.6 | 5.3 | 0 | 58 | |
| Today | 2.0 | 3.4 | 3.8 | 6.0 | 0 | 52 | |
| Storm Seraph fight | Before | 1.7 | 2.5 | 2.9 | 4.5 | 0 | 60 |
| Round 1 | 1.8 | 2.8 | 3.4 | 3.9 | 0 | 59 | |
| Today | 2.0 | 3.3 | 3.8 | 4.7 | 0 | 60 | |
| Arriving on Floor V | Before | 2.0 | 3.4 | 3.7 | 8.7 | 0 | 63 |
| Round 1 | 2.2 | 3.5 | 4.4 | 10.4 | 0 | 65 | |
| Today | 1.9 | 3.1 | 3.7 | 8.8 | 0 | 65 |
Before = commit b1ccb70, Round 1 = commit 2d02b95, Today = commit 12eb2f9. Frame cost in milliseconds, both runs pooled; draw calls are the most seen in one frame.
The honest summary: on this machine every build was already well inside the budget in these scenes, and none of the runs recorded a single long task (a main-thread block over 50 ms). The Sprint #2 work shows up where the team said it would: in load time, and in the worst frames of the room where the floor falls away. The rest of their fixes target things these scenes don't hit on a fast Mac: first-use shader compiles in specific effects, resolution changes on slower machines, and memory over a long session.
The traces themselves are here, so anyone can open them in Chrome DevTools (Performance panel, "Load profile"): before, after perf round 1, today (horde scene, about 4 MB each).
Lots on screen, few draw calls
The other half of performance is not doing work in the first place:
- The dungeon is about 10 to 20 draw calls. Static pieces are merged into chunks per texture atlas; a character is one or two. The bot's floor runs fail any fight over 90 draw calls; the twelve-elite horde with stacked boons in these profiles peaks around 140.
- Pooled particles. Every spark, ember and puff of smoke comes from two pooled particle systems; nothing is created and thrown away per effect. Particles far from the camera aren't spawned at all, and the Medium and Low presets genuinely cut them.
- Pooled, instanced projectiles. The Rogue's throwing knives and the Pyromancer's arrows and fireballs are each one instanced mesh, reused shot after shot. Procedural creatures are batched too: a crawler's six legs are instances of one mesh, which took a nine-enemy Floor IV fight from 150 draw calls to 110.
- Shader programs are kept. three.js frees a compiled shader when the last material using it goes away, so every effect that came and went caused a fresh compile and a 4 to 30 ms hitch every few seconds of combat. The game now keeps every program for the session.
- The number of lights never changes. Changing it recompiles every shader, so the game uses a fixed set of torch, hero and flash lights and moves them around.
Memory, and power in menus
A long session is a different test from a single fight. The Performance team ran ten restarts, ten Save & Quit and Continue cycles, ten rounds of every overlay, four full descents and ten 30-second Gauntlet sessions, forcing garbage collection before every measurement, and found four leaks: skeleton textures that were never freed, procedural monsters' geometry, summoned enemies orphaned by a list being modified while it was walked, and Photo Mode creating a new shader every time it opened. After the fixes, restarts, descents and overlays are flat; textures on the title went from 59 to 32. Part 7 has the full table.
Memory for sound got the same care: music loads per floor and frees the old floor's (all of it decoded at once was about 400 MB), and the sound-effect sprite is decoded in mono at 32 kHz, about 110 MB instead of 325. Those two figures are calculated from the audio lengths and formats, not measured on a particular machine.
Paused screens don't need 30 redraws a second of a frozen world. The pause menu, Settings, the Codex, Trophies and Vows now redraw it every third frame while still reading input every frame: busy time per second fell from 32 ms to 13 in the pause menu, 30 to 12 in Settings and 22 to 8 in the Codex (MacBook Pro M3 Max, Chrome, High quality, 1512×945 at 2x).
The referee
None of this would hold without the test battery. Before every ship, the bot clears all seven floors, and a regression run records frame-time percentiles and draw calls for each one. At the overnight sprint's hand-back, that run showed every floor cleared, a 95th-percentile frame interval of 17.3 to 18.2 ms against the 60 fps cap (in other words, frames arriving on time), at most 64 to 80 draw calls, no errors, and a worst frame of 9.6 ms on any floor arrival, down from 74 ms (headless Chrome with Metal on the same MacBook). A change that makes the game slower shows up in a number before it shows up in someone's hands.